
I’ve added a new report, called the Balance Report. With this you can see what your account balance is expected to be for any week up to 3 years in advance! You can avoid overdraft scenarios and predict any problems many months before they happen.
What’s cool about this is that it lets you quickly see what you can or can’t afford to spend on. If for example you were thinking about adding a new monthly bill, you can create that repeating transaction and then go look at this report to see what that new monthly bill would actually mean to your account balance months down the line.
You can also use it to see how much you can save. If you want to see if you can afford to save an extra $200 a month, create that repeating transaction and take look at your balance report. If you don’t see red, you are good to go!
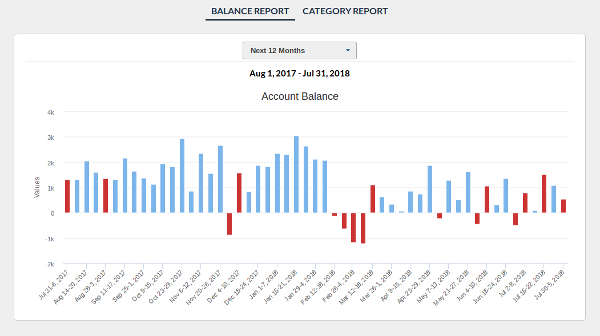
Each bar in the chart represents the week’s ending balance. When you see a positive red bar, it means at some point during that week, your bank account balance will go negative, but it ends positive. If the red bar is negative (below the 0 line), it means your balance will end negative on that week.
If you want to see what’s going on in those future red weeks, you can click on them to be taken to the cash flow screen for that week so you can try to fix any issues. On the app or on the mobile site, you don’t click on the bars themselves. You click on the balances that are listed below the chart.

